Analytics
Where the money is and what needs attention, before you open a single claim.
Who Can See It
Section titled “Who Can See It”User, Manager and Administrator, where reporting access is granted.
The Catalog
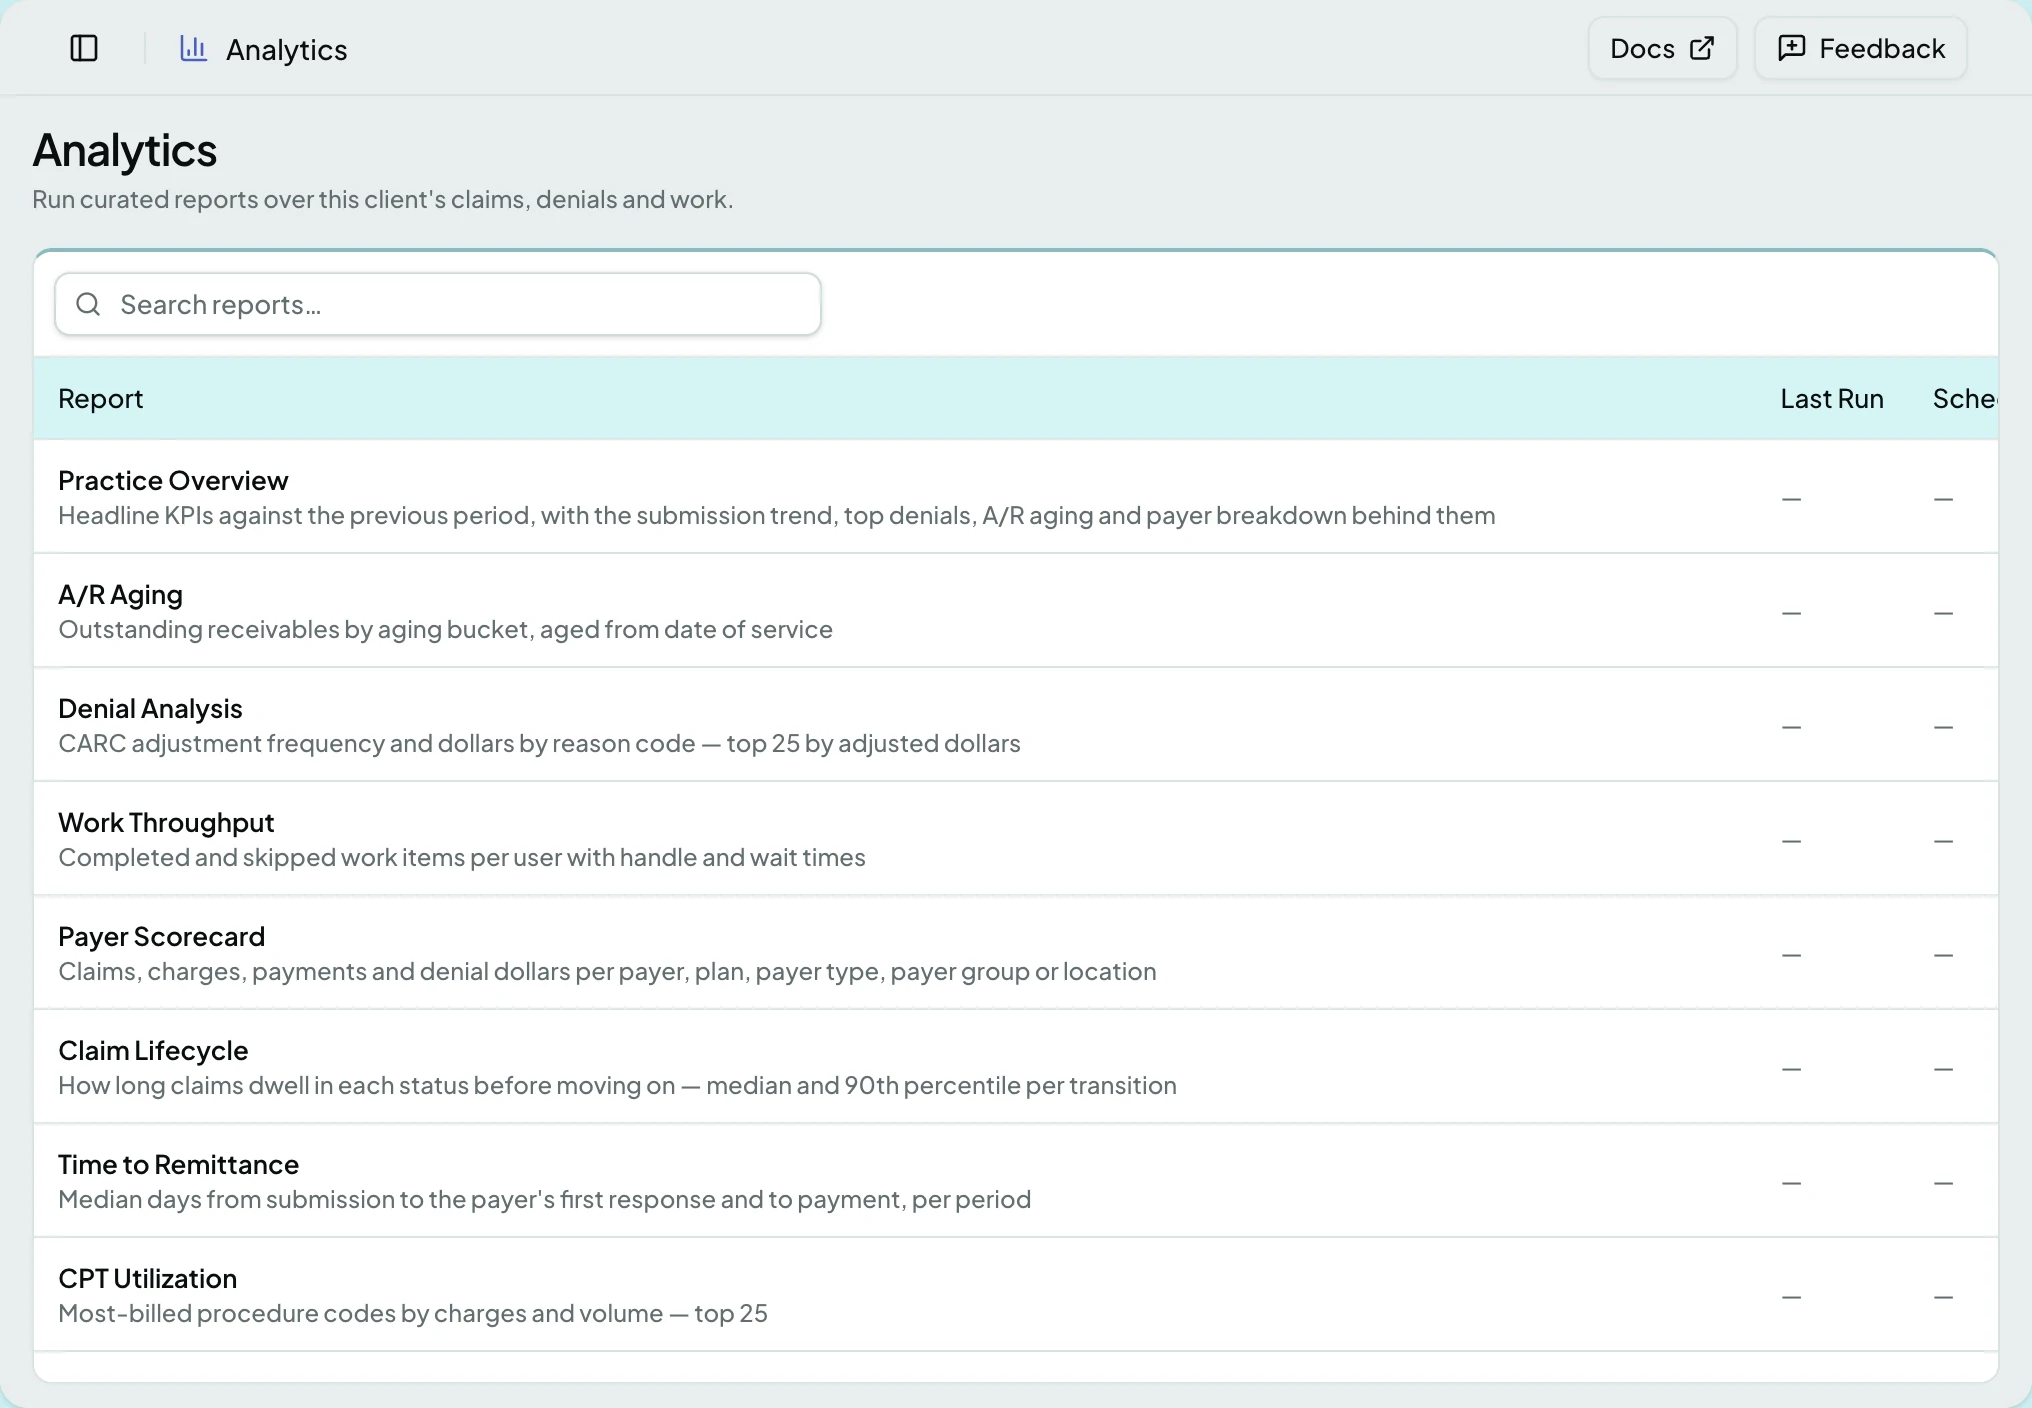
Section titled “The Catalog”Analytics opens on a catalog of the reports available for this client, not on a dashboard of its own - the KPI strip and claim-status chart live on the Dashboard.
| Column | What it shows |
|---|---|
| Report | The report name and what it answers |
| Last Run | When it was last run, or a dash |
| Schedule | Whether it runs on a timer |
Thirteen reports is more than a screenful, so the catalog searches by name.
Reports
Section titled “Reports”| Report | What it answers |
|---|---|
| Practice Overview | Headline figures against the previous period, over the trend, the top denials, the A/R aging and the payer breakdown behind them |
| A/R Aging | What is outstanding, bucketed by age, aged from the date of service |
| Denial Analysis | CARC frequency and dollars by reason code - the top 25 by adjusted dollars |
| Work Throughput | Completed and skipped work items per person, with handle and wait times |
| Payer Scorecard | Claims, charges, payments and denial dollars per payer - the document a renegotiation is argued from |
| Claim Lifecycle | How long claims sit in each status before moving on, median and 90th percentile per transition |
| Time to Remittance | Median days from submission to the payer’s first response, and to payment |
| CPT Utilization | The most-billed procedure codes by charges and volume - the top 25 |
| Diagnosis Utilization | The same for diagnosis codes |
| Rework & Reverts | Claims sent back to Draft after review, against claims released - the rework rate |
| Clean Claim Rate | Claims that passed every edit the first time they were reviewed, against claims reviewed |
| Month-End Financial Summary | The ledger roll-forward - opening A/R, charges, payments and adjustments closing to ending A/R - with collection rates and days in A/R |
| Collections Statement | Cash posted in the period, split between insurance and patient, beside the claims submitted in it |
Opening a report runs it, and it re-runs as you adjust its parameters. Run Now on a catalog row runs one without opening it.
Practice Overview is the exception: it is a screen rather than a report, so it has no Run Now, no download and no schedule. Opening it goes to the overview instead.
The Practice Overview
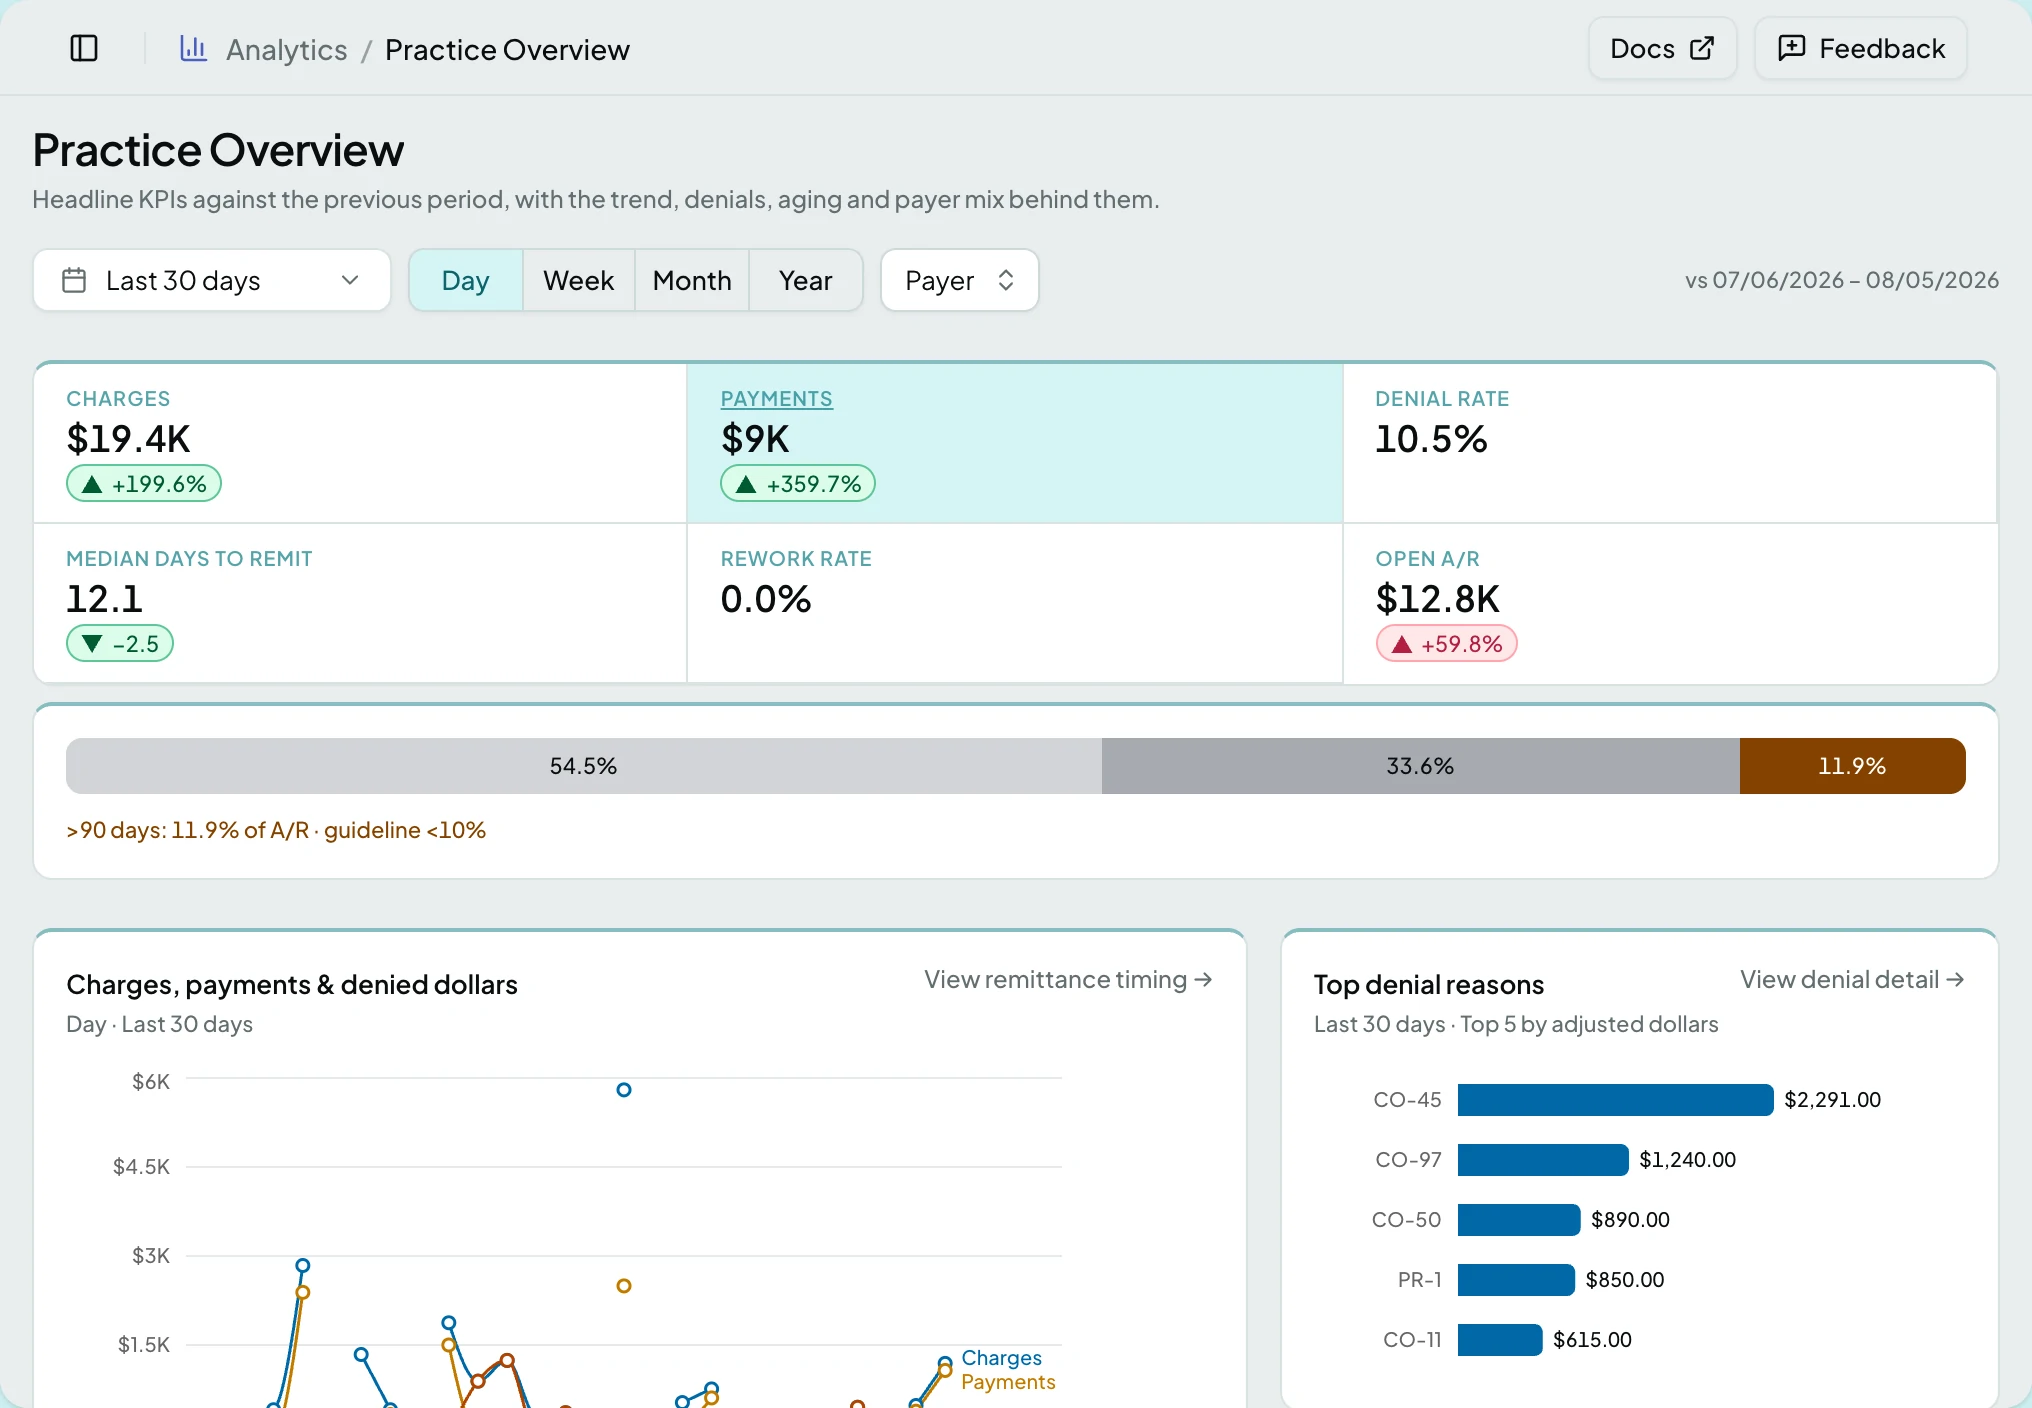
Section titled “The Practice Overview”Six figures for the period, each shown against the same length of time before it, so the number carries a direction rather than sitting alone.
| Figure | What it counts |
|---|---|
| Charges | What was billed |
| Payments | What was collected |
| Denial rate | The share of claims denied |
| Median days to remit | How long the payers took |
| Rework rate | Claims sent back to Draft after review |
| Open A/R | What is still outstanding |
Beneath them sit three bands: Charges, payments & denied dollars over time, Top denial reasons by CARC and adjusted dollars, and a breakdown by whichever dimension you choose.
Three controls run the page: a Date range, Group trend by (Day, Week, Month or Year) and Break down by.
The Report Viewer
Section titled “The Report Viewer”Opening a report runs it and shows the result.
Each report takes its own parameters, so the bar above the result differs.
| Parameter | Which reports take it |
|---|---|
| A date range | Every report except A/R Aging, which has no window - it reports what is outstanding now |
| Buckets | A/R Aging only. Presets are offered, and the edges can be changed for a one-off view |
| Group by | Time to Remittance, Rework & Reverts, Clean Claim Rate and Month-End Financial Summary, as Day, Week, Month or Year |
| Break down by | Payer Scorecard and Collections Statement, as Payer, Payer group, Payer type, Plan, Provider or Location |
Above the table sits a band summarising the result - the aging split, or the top offenders - and beneath it the rows themselves.
Changing a parameter re-runs the report. Refresh report runs it again without changing anything, and the header carries the time it was generated.
Actions
Section titled “Actions”| Action | What it does | When it is greyed |
|---|---|---|
| Run Now | Runs the report from the catalog | While another report is running |
| Schedule… | Puts the report on a timer | Shown only to those who can schedule |
| Download CSV | Downloads the last result | Until a run has succeeded |
| Download XLSX | The same as a spreadsheet | Until a run has succeeded |
| Download PDF | The same as a document, laid out to print | Until a run has succeeded |
States
Section titled “States”- Empty - a client with no claims shows zeroed KPIs and empty charts rather than blank panels.
- No rows in this period suggests widening the date range or changing the parameters.
- Couldn’t run this report if the run itself failed.
- This report doesn’t exist for an unknown report.
- Blocked - without reporting access the screen is not in the sidebar, and a saved link to it says so.
Related: Dashboard · Claims · Insurance Plans