Dashboard
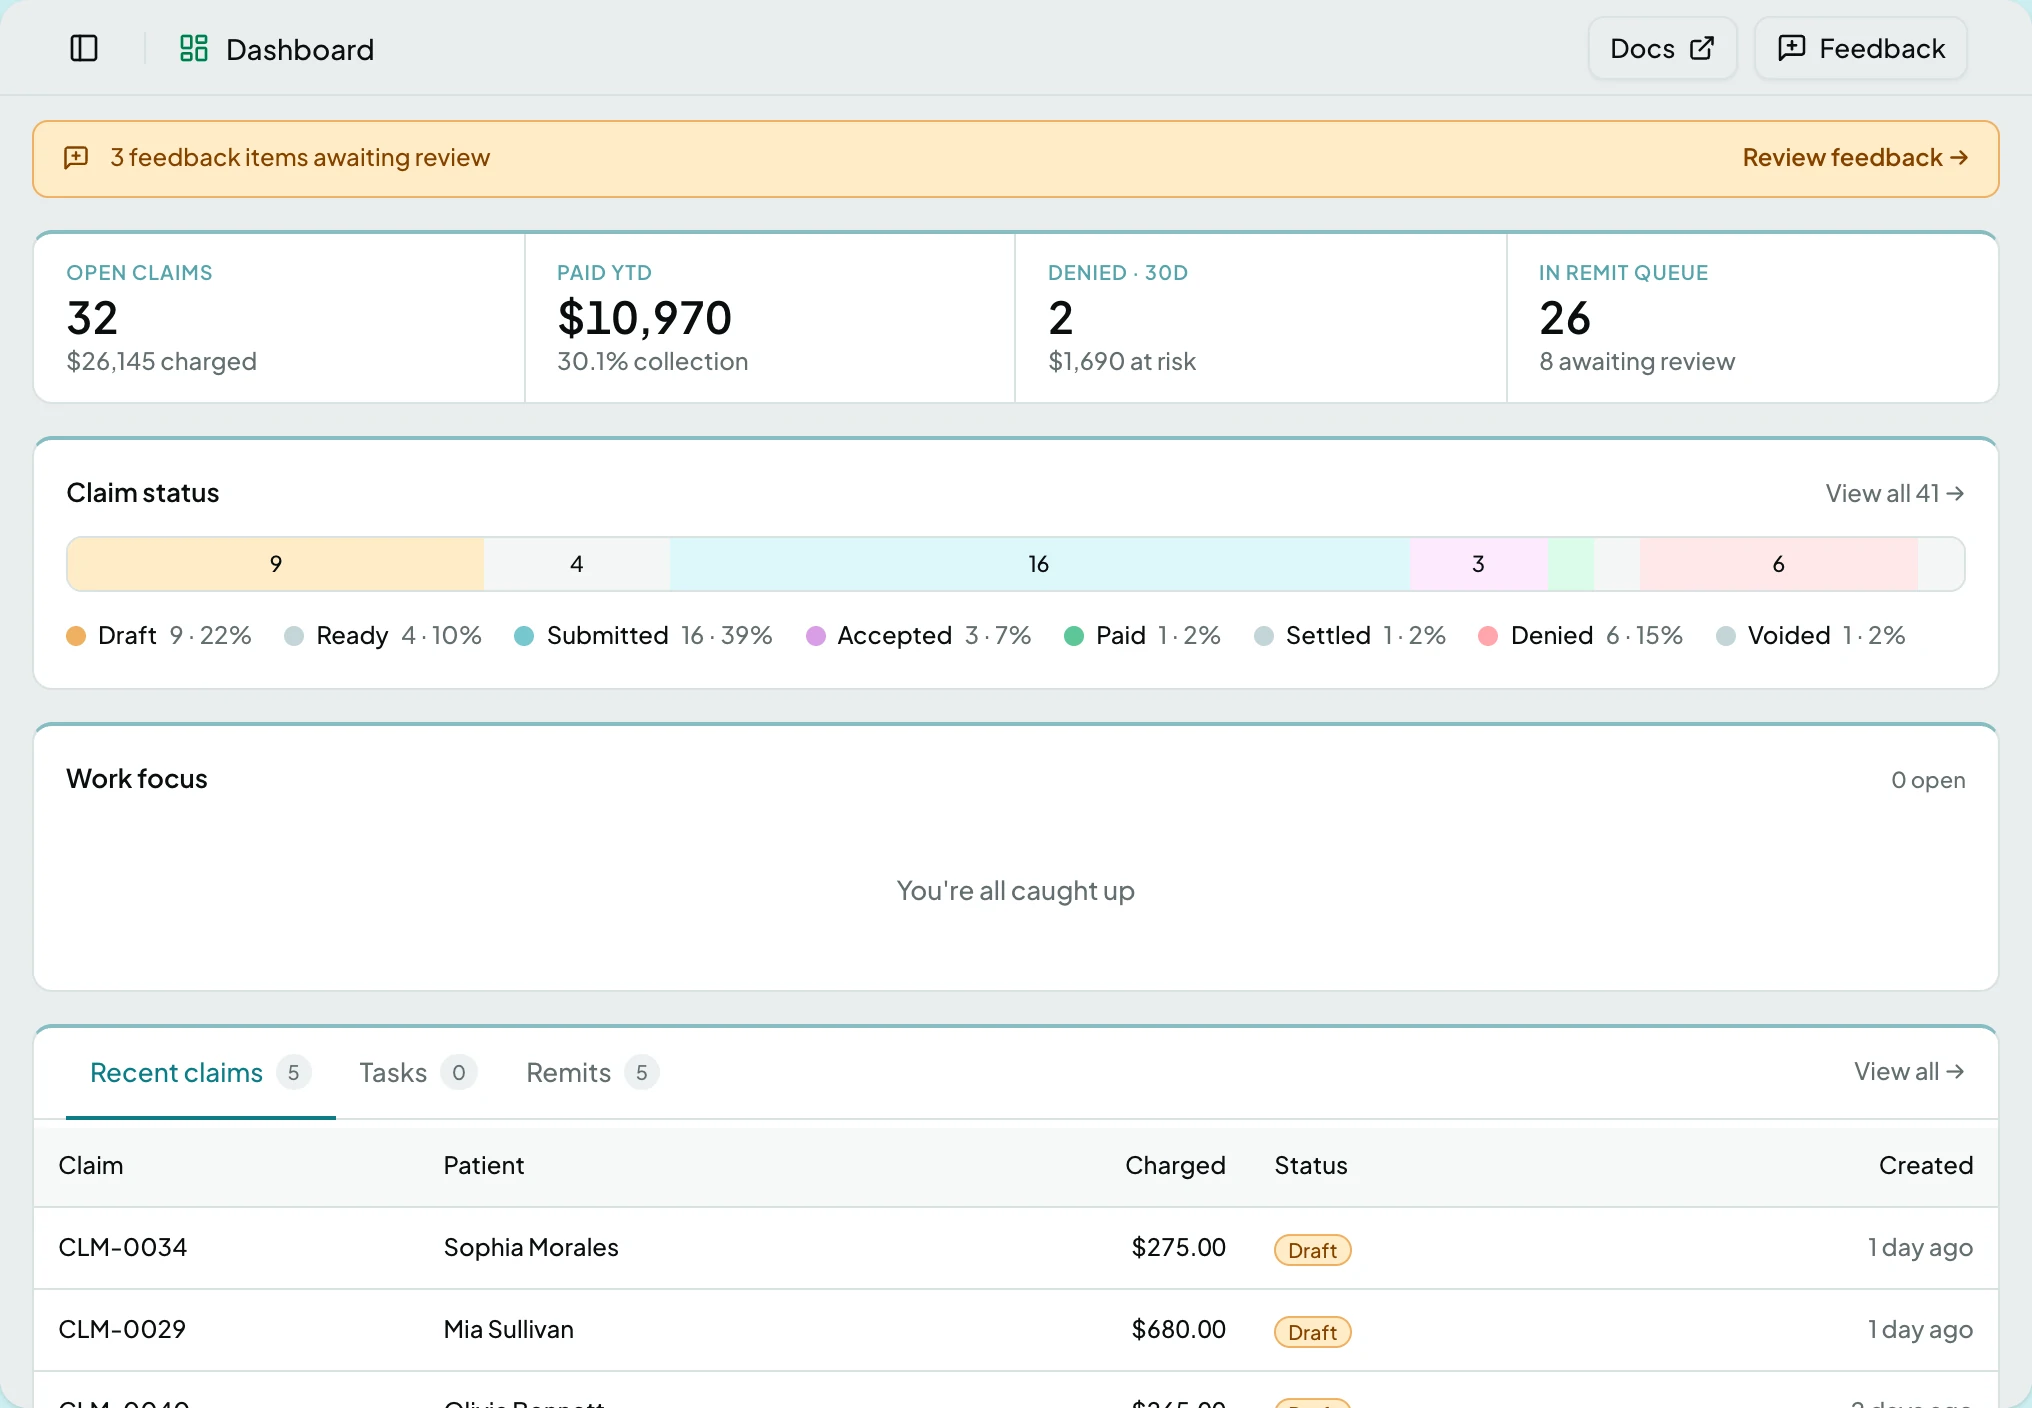
The screen ClaimPod opens on. It answers three questions before you open anything: how much money is in flight, how the claims are distributed, and what is waiting for you specifically.
Who Can See It
Section titled “Who Can See It”Anyone signed in, scoped to the client in the switcher.
The KPI Strip
Section titled “The KPI Strip”| Figure | What it counts |
|---|---|
| Open claims | Claims not yet resolved, and what they charge |
| Paid YTD | What has been collected this year, with the collection rate |
| Denied · 30d | Denials in the last 30 days, and the amount at risk |
| In remit queue | Remittances waiting, and how many need review |
Claim Status
Section titled “Claim Status”A single bar showing how the client’s claims divide across the lifecycle, with a count and a share for each status. It is the fastest read on whether work is piling up at one stage.
Work Focus
Section titled “Work Focus”What is assigned to you and still open, so the dashboard is personal rather than a summary of the whole client. When there is nothing outstanding it says You’re all caught up.
Recent Activity
Section titled “Recent Activity”Three tabs over what changed lately.
| Tab | What it lists |
|---|---|
| Recent claims | Claim, Patient, Charged, Status, Created |
| Tasks | Background work and its outcome |
| Remits | Remittances received, with payer and amount |
States
Section titled “States”- You’re all caught up when nothing is assigned to you.
- We couldn’t load your dashboard if the summary cannot be fetched.
- A banner appears when feedback is awaiting review, with a link into it.
Related: Analytics · Work Queues · Claims